Initial Testing
I started it up and since the array was initially all 0's, no motor activity occurred.
I send it a 1 for the total number of pulses. I expected to see the pump move/step once a second. I could not see it move, but I could feel it "tick" regularly, once a second. Note this is the slowest speed I can run the motor at this time, see To Go Slower.
I tried 100 and the pump moved slowly but visibly.
I tried various numbers all the way up to 3000 or so, at which point the pump stalled. I checked the EasyDriver Controller doc and on it's board there is a current limiting pot. By playing with it (i.e. giving the motor more current), I was eventually able to consistently go up to 6000 pps without the motor stalling. Note the 6000 pps is about 2200mL/hr and so is faster than my goal.
Initial Test Results
I modified my script that does the test runs to automatically distribute tests across as wide a range of PPS values as possible. I ran that script and gathered a bunch of test data. It saves it in a YAML file.
I then wrote a script to analyze the test data. It reported these ranges:
Flow Rates : 214.40573840907038 - 2615.660888644071
Pulse Rates: 600.0 - 6000.0
I then added some analysis to check the various test points:
    pps=1000 flowrate=420.7804556629142
    pps=1000 flowrate=423.32183609541386
    pps=1000 flowrate=419.477884396956
pps=1000 flow rate: avg=  421.2 stdev=    1.6 var=    2.5

    pps=2000 flowrate=868.612336820135
    pps=2000 flowrate=856.8257377116644
    pps=2000 flowrate=949.2405405783727
pps=2000 flow rate: avg=  891.6 stdev=   41.1 var= 1686.7

    pps=3000 flowrate=1271.3429369952762
    pps=3000 flowrate=1256.4792837666005
    pps=3000 flowrate=1264.644055545798
pps=3000 flow rate: avg= 1264.2 stdev=    6.1 var=   36.9

    pps=4000 flowrate=1752.8973565032595
    pps=4000 flowrate=1748.6259648081364
    pps=4000 flowrate=1747.6591175461313
pps=4000 flow rate: avg= 1749.7 stdev=    2.3 var=    5.2

    pps=5000 flowrate=2145.3437171767737
    pps=5000 flowrate=2142.747967244612
    pps=5000 flowrate=2112.73950316454
pps=5000 flow rate: avg= 2133.6 stdev=   14.8 var=  218.9

    pps=6000 flowrate=2582.987955450938
    pps=6000 flowrate=2133.873433862267
    pps=6000 flowrate=2016.7974988937865
    pps=6000 flowrate=2615.660888644071
pps=6000 flow rate: avg= 2337.3 stdev=  265.5 var=70487.9

    pps=800 flowrate=339.3260210637104
    pps=800 flowrate=337.11389189229425
    pps=800 flowrate=339.6241870029783
pps=800 flow rate: avg=  338.7 stdev=    1.1 var=    1.3

    pps=700 flowrate=297.32804103160066
    pps=700 flowrate=296.6882582660865
    pps=700 flowrate=295.4479627195224
pps=700 flow rate: avg=  296.5 stdev=    0.8 var=    0.6

    pps=750 flowrate=314.7873592318074
    pps=750 flowrate=318.0895512112209
    pps=750 flowrate=315.0316299789516
pps=750 flow rate: avg=  316.0 stdev=    1.5 var=    2.3

    pps=900 flowrate=379.64984890564966
    pps=900 flowrate=377.24904608189496
    pps=900 flowrate=381.2918206629654
pps=900 flow rate: avg=  379.4 stdev=    1.7 var=    2.8

    pps=1500 flowrate=630.7612611581272
    pps=1500 flowrate=629.6932758606342
    pps=1500 flowrate=632.0642923625697
pps=1500 flow rate: avg=  630.8 stdev=    1.0 var=    0.9

    pps=2500 flowrate=1066.235696078983
    pps=2500 flowrate=1069.8607691426694
    pps=2500 flowrate=1077.8802506769603
pps=2500 flow rate: avg= 1071.3 stdev=    4.9 var=   23.7

    pps=3500 flowrate=1500.126087707016
    pps=3500 flowrate=1499.2349016840972
    pps=3500 flowrate=1487.5333209516668
pps=3500 flow rate: avg= 1495.6 stdev=    5.7 var=   32.9

    pps=4500 flowrate=1949.6369633799861
    pps=4500 flowrate=1958.4553248296286
    pps=4500 flowrate=1955.755010815901
pps=4500 flow rate: avg= 1954.6 stdev=    3.7 var=   13.6

    pps=5500 flowrate=2351.1999069038375
    pps=5500 flowrate=2377.0546723227653
    pps=5500 flowrate=2346.0663460539377
    pps=5500 flowrate=2384.2089006846
pps=5500 flow rate: avg= 2364.6 stdev=   16.3 var=  265.7

    pps=600 flowrate=214.40573840907038
    pps=600 flowrate=249.72087920847153
    pps=600 flowrate=250.77452851304736
pps=600 flow rate: avg=  238.3 stdev=   16.9 var=  285.7
The first few lines of every section shows the actual pps and flowrate data. The final line shows the average flow rate, the standard deviation and variance. There are a couple of values that jump out:
- pps = 6000, the variance is very high
- pps = 2000 seems to have a high variance as well
Here is the data in a graph: 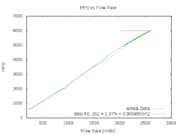
You can clearly see the anomaly in the pps=6000 data. The pps=2000 data is a little more subtle in that the line "veers" off to one side a little.
The coefficients are displayed on the graph too. My script actually calculates multiple regression formulas with order 1 - 3 and displays the best line on the same graph in green. Here are all the coefficient sets it found:
    fit where x is rate, formula returns f(x)=pps to use
    Note: lower chi squared is better
    Sample: for flowrate=297 expected pps=700
    order: 1
       coefficients: [ -8.219e+00 2.376e+00 ]
       chi squared : 2698848.495 valid: 0
       sample x=     297  f(x)=698
                  expected=700

    order: 2
       coefficients: [ -1.072e+01 2.383e+00 -2.424e-06 ]
       chi squared : 2698790.255 valid: 0
       sample x=     297  f(x)=697
                  expected=700

    order: 3
       coefficients: [ 2.522e+02 1.365e+00 8.953e-04 -2.183e-07 ]
       chi squared : 2528484.682 valid: 0
       sample x=     297  f(x)=731
                  expected=700
The "sample x=" is just a simple calculation I did by using actual data from the tests. The idea is that it is a quick and dirty double check. The flowrate of 297 (x value) should result in an expected pps of 700. The various coefficient sets get pretty close.
These calculations were done by the GNU Scientific Library and the matching ruby gem gsl. I also used the ruby gem descriptive_statistics to do the stddev and mean calculations:
    #     for the GNU Scientific Library:
    #        gem install descriptive_statistics
    #        sudo apt install gsl-bin libgsl0-dev
    #        gem install gsl
    #
    #     for gnuplot
    #        sudo apt install gnuplot-x11
    #        gem install gnuplot
    #
    #  ############################################################==
    require 'descriptive_statistics/safe'
    require 'gsl'
    require 'gnuplot'
You can see I used gnuplot to do the graphing. I had originally used imagemagick but the resulting graph wasn't as clean:
sudo apt install libmagickwand-dev imagemagick
sudo gem install imagemagick
require 'rmagick'