Test Equipment
See below in section "The Scale" below for a more extensive discussion of problems with the scale.
The end result of all the testing is to acknowledge that the scale will have problems dealing with extremely low rates. There may be problems even if normal statistical techniques are used to eliminate noise in the readings.The noise is not consistent and may not even be random or normally distributed.
The workaround is ... TODO. I believe my best strategy at this point is to establish the linear regression formula at higher rates and then use that for all rates. Then perform as much testing as I can at the lowest rates.
My reasoning is this: the pumping mechanism's response to a single stepper pulse should be the same across all rates. It should pump the same amount of fluid whether it is a stream of pulses or a single pulse within a time span of a second. However, this may not be true and the only way to determine if it is or not is to have accurate test results at all rates. If I can test at very low rates, then I may get lucky and gather some data from a good run or two. That will help! But given the limitations of the scale and my test environment (my kitchen table), well, at this point, this is the best I can do.
(Current) Acculab/Sartorius Scale
The first scale an Ohaus (see section "Ohaus Scale") had some problems because of it's low resolution.
To overcome these I bought another scale, an Acculab that has a 0.001g resolution up to 300g max value. Acculab
Wind Effects
This scale is a 100 times more sensitive than the Ohaus. In fact, it is so sensitive that air currents can change the reading. From a couple of feet away, blowing towards the scale can cause it to change by 0.050g or more. Closer, it can change up to 0.4g or more.
The scale comes with a cover, a "windscreen", which reduces the effect substantially. However, the cover has a hole in the top, so it is still possible to make it change by -0.002g or so. Note that the change is negative. The reason is that air blowing over the hole causes the Bernoulli Effect, i.e. it creates a vacuum and the scale registers the force of that vacuum. Bernoulli's principle
In short, there could be very slight changes in the reading simply by air currents (e.g. furnace or A/C turning on) surrounding the scale. To get a better understanding of how big an effect this is, I set up a test where I took a reading every second for 2 hours and I counted the number of times the scale was non-zero. Since there was nothing on the scale and since I tared it at the start of the run, the expectation is that of the 7,200 readings, they should all be 0.000g. There were in fact, 367 readings that were non-zero, i.e. 5.1%. They were mostly +/- 0.001g and a dozen or so at +/- 0.002g. I did not calculate a standard deviation for these readings.
Some of these non-zero readings may have been from noise within the scale itself. Again, I assume that it samples the sensor(s) multiple times for each displayed reading and that the sensor has noise.
Evaporation
Another problem was evaporation. When there was fluid in the receptacle and the pump stopped, the readings would drift slowly downwards. The best explanation for this was evaporation.
To informally test for this, I took an open receptacle and filled it with water until it read 100.000g (or so). I took a reading every 10 - 20 minutes (literally on the back of an envelope) and kept track for a couple of hours. The windscreen was up, so this may have had an effect on some of the readings. The readings dropped substantially, roughly 0.040g to 0.060g per hour. Note there were rough measurements and guesses, so this is not completely accurate, but it did account for the change in readings.
To double-check, I re-ran the same test with the same receptacle but this time with the lid tightly closed on it. Informally, the readings were very stable, hovering around +/- 0.001g as they normally are. In short, the slow drift downwards is fluid evaporation.
Evaporation - Small Petri dish using a script
To double-check even further, I wrote a script to run the evaporation test automatically, so I did not have to trust my note-taking capabilities. This time the receptacle was a small petri dish about 70mm in diameter. It has a cover, but for this test, I left it off. I ran a script which took a reading every minute for 5 hours. The weight readings dropped from 30.624g to 29.428g over the 5 hours, a total of 1.196g drop which is 0.239g per hour average rate. I plugged those values into a LibreOffice spreadsheet, plotted it on a graph and calculated the linear regression formula for the data. The slope of the line is -5.8819E-06 which indicates that the evaporation rate was 5.89 micro-grams every second or about 0.021g every hour. This is less than when I did the same measurements informally but in the same ballpark.
I ran the test again. I refilled the petri dish and put its cover on it. This time the readings dropped from 34.823 to 34.763g, a total of 0.060g which is 0.012g per hour average rate. The linear regression slope is -3.1958E-06, which is 0.011g every hour. The is less than the uncovered evaporation rate, but still relatively high - roughly 10% - in relation to a fluid rate of 0.1mL/hr.
Evaporation - Large Petri dish using a script
I redid the tests with a larger petri dish. To make the graph look a little nicer, I modified the output to print every minute instead of every second. Note there could have been changes in these readings as well because of ambient temperature and humidity levels.
Uncovered, the weight readings dropped from 52.545g to 52.072g over the 5 hours, a total of 0.473g drop which is 0.0946g per hour average rate.
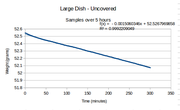
The slope of the line is -1.506-03 which indicates the evaporation rate was 0.015g (15mg) every minute or about 0.090g (90 mg) every hour. Note the R2 value is 0.999 which indicates that the linear slope of this line is a very tight fit. And also note that this rate (0.090g/hr) is faster than the small petri dish rate of 0.021g/hr. This is expected because of the larger surface area of the new petri dish.
Covered, the weight readings dropped from 58.842g to 58.816g over the 5 hours, a total of 0.026g ( 26mg) drop which is 0.005g (5mg) per hour average rate.
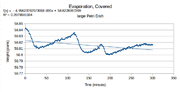
The slope of the line is -4.956E-05 which indicates the evaporation rate was 4.95 micro-grams every minute or about 0.003g (3mg) per hour average rate. Note the R2 value is only 0.207 which indicates the line is not a good fit. This is most likely due to random noise in the readings. And also note that this rate is substantially less than the uncovered rate, as expected.
Evaporation - Large Petri dish with a small hole in the cover
To be able to drip water into the Petri dish, I drilled a hole in the cover. I reran the test once more, with the cover (with the hole in it) on the petri dish. This should get the evaporation rate of my final setup.
In this case, the weight readings dropped from 36.952g to 36.898g over the 5 hours, a total of 0.054g drop which is 0.011g per hour average rate.
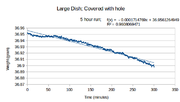
The slope of the line is -0.000174 which indicates the evaporation rate was 171 micro-grams every minute or about 0.010g (10 mg) every hour. Note the R2 value is 0.961 which indicates that the linear slope of this line is a tight fit.
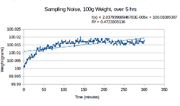
Sampling Noise
I did one test, were I put a metal weight (100g) on the scale and read its weight over 5 hours. The expectation is that it would weigh 100.000g over the full 5 hours since there was no evaporation or other effects on the scale.
The results indicate an increase in the weight readings of 0.017 (17mg) over the course of the test. The R2 value was 0.47 which indicates the line is not a good fit, which is expected. The "slope" of the line is 2.837E-005 which indicates a change of 28.37 micro-grams every minute or about 0.14mg per hour.
Here's another run:
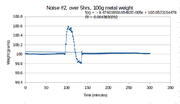
This shows a nice flat run, except for a 0.600g spike that occurred around 100 minutes into the test. The R2 value shows as 0.004 which clearly indicates a bad fit.
Tubing Forces
The input of the pump is connected to some tubing which I placed into a plastic reservoir and filled with water.
The output of the pump is also connected to some tubing. I strapped that to the outside of the receptacle - a plastic bottle. I drilled a hole in top/side of the bottle and fed the tubing through the hole. As the fluid came out of the tubing, it would drip into the side/top of the bottle and be measured by the scale. The bottle has a cap to minimize evaporation.
Periodically, I had to empty the bottle. I would take the bottle off the scale, take off the cap and pour the water back out into the reservoir. And then put the cap back on and place the bottle back on the scale.
I noticed that the scale value would change quite a bit at this point. Sometimes as much as a gram or two. Eventually this was traced to the uncoiling of the tubing which put various forces against the length of it and therefore to the bottle. Those forces were causing the scale readings to change.
To test this, I emptied the bottle and just let the scale sit there. I waited for the scale to stop moving and periodically (informally!) wrote the readings down. The scale continued to change over the course of a day and eventually stopped moving on the second day.
The tubing is not pliable (see silicone tubing for model airplane fuel tanks silicone tubing. To overcome this, I did this:
- put brass tubing into the silicone tubing
- built a stand that holds the tubing
- the brass tubing outlet is held over the hole in the bottle by the stand
One downside is that the hole in the bottle leads to higher evaporation rates.
Another is that the initial setup is more complex. The brass tubing has to be precisely over the hole in the receptacle. To help with this, I bought some small petri dishes. Instead of using a bottle, I will use a petri dish that fits inside the windscreen of the scale. I will drill a hole in the petri cover just barely larger than the brass tubing. This should be marginally easier to set up.
Slow Drip
When the pump is on, fluid comes out of the end of the tubing. It accumulates into a drop until it weighs enough to fall into the receptacle. In other words, that fluid is "delivered" but not weighed -- for a while. Then it finally drops, causing the reading to suddenly "jump".
At high rates, this isn't a problem. The drops are more or less continuous and the time lag is not significant.
For very low rates, this is a problem. The time lag between delivery and measurement potentially causes the calculation of the fluid rate to be off.
Also analysis of "fluid delivery continuity" is probably impacted. There is a expectation that the fluid delivery is even and constant across any time span. At low rates it can be step-wise (e.g. jumping upwards periodically) to some extent but it is important to make that delivery as smooth and as even as possible.
And finally, to a lesser impact, the surface area of the drop causes more evaporation than necessary.
To overcome this, I will put a small copper wire into the end of the tubing. The idea is that the wire breaks the surface tension of the drop and the fluid should flow down the wire into the receptacle.
A couple of caveats:
- If the wire is too small, it doesn't break the surface tension.
- If the wire is too large, it becomes another spot for the drop to accumulate.
TODO I need to experiment to see if there's a better way...
Ohaus Scale
The first scale I used, an Ohaus, had a resolution of 0.1g and a max reading of 400g. Ohaus
Low Resolution Effects
At very low rates, the expected behavior is for readings to smoothly increase from one value to another as fluid accumulated in the receptacle on the scale. The low resolution would not cause any problems and the readings would change smoothly and accurately relative to the rate of fluid flow.
But in fact the readings would not change smoothly. It would sometimes change too soon and "jump" to the next value. For example, say it was reading 1.3g. At a particular control value (e.g. a control value of 22, or N pulses per second) the expected rate was 0.1g/hr, and therefore the expectation was also that it would take an hour to change from 1.3g to 1.4g. But because of the scale resolution of 0.1g, a displayed reading of "1.3g" could actually be anywhere from 1.30g to 1.39g, or even slightly outside this range. An additional drop of water could cause the reading to not change at all or to suddenly change to the next value 1.4g. Therefore, the actual amount of time to reach a given amount of fluid could be much shorter than the expected time.
This caused havoc in calculating the actual rate. I was calculating the rate using the time it took to see an expected reading. For example, I would run the motor at some control value, timing how long it took for the scale to change from 0.0 to 1.0g say. If that time was 1 hour, then the control value represented an actual rate of 1 mL/hr. If the time was 2 hours, then the actual rate was 0.5 mL/hr. For the actual rate to be accurate, both the time and weight measurements have to be accurate. If the scale reading "jumped" too soon, the calculated rate could be substantially off. Since the time for the scale reading to change could vary a lot, the calculated rate could vary a lot as well.
Drift
Another problem is that the value would change upwards (as it should) and then dip back down, toggling back and forth for a while until it finally stabilized and resolved to the next higher value. For example, if the reading was 1.3g, an additional drop of water would cause the reading to move to 1.4g but a few seconds later it would read 1.3g again. Another drop of water would cause the reading to move to 1.4g again and it would stay there a bit longer but still drift back to 1.3g again. Eventually a final drop of water would cause the reading to move to 1.4g permanently. This behavior makes sense if, internally, the scale was not taking a single sample of its sensor(s) but was taking many samples and presenting a moving average to display a reading. If there was signal variation (aka noise) from that sensor, the external display would drift slightly if the weight was close to a 0.1g boundary.
I added a bit of "hysteresis" to the test software to help overcome this: I had to see the same scale value for 3 contiguous readings for it to be actually at that value. I tried different counts (up to 10) but 3 seemed to be ok. I also added a short delay after I stopped the pump to allow the scale reading to settle down. Neither of these are great solutions and could cause additional inaccuracies, but those inaccuracies are most likely smaller than not having the workarounds in place.
Sudden shifts
Another troubling problem that occurred is that the reading would suddenly vary. For example, if it was reading 1.3g for a few minutes, it would suddenly shift downwards a few tenths of a gram, say to 0.7g, for 10 - 20 seconds and then rise back up to its previous value of 1.3g.
More rare was at times it would rise up temporarily to a higher value for a time and then fall back down to its previous value. This caused some issues if it was close to the end of the run. The run would terminate too soon and the rate calculation would be substantially off.
Software
The control software is straightforward. It was all written in Ruby running on Ubuntu (Linux).
Opening and closing the ports was straightforward. Over time, I found that there was some internal buffering going on in the scale, and so there could be garbage characters on the first read. To clear those buffers, after initialization, I would read the port until Nulls were returned.
The goal for the control software was to be able to send down a rate, say 100 mL/hr, and the correct control value would be chosen and sent to the pump. There were two steps done to achieve this:
- find out what the actual fluid rate is for a given control value
- create a function that, given the requested fluid rate, returns the control value to command the pump